Legislators
| Name | State | District Sort descending | Party | Score | Lifetime Score | |
|---|---|---|---|---|---|---|

|
Rep. Jim Jordan | 4 |  Republican
|
0%
|
0%
|
|

|
Rep. Mike Johnson | 4 |
Republican
|
0%
|
5%
|
|

|
Rep. Robert B. Aderholt | 4 |
Republican
|
0%
|
5%
|
|

|
Rep. Jake Auchincloss | 4 |  Democrat
|
100%
|
100%
|
|
|
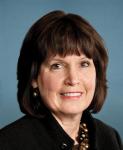
Rep. Betty McCollum | 4 |
Democrat
|
100%
|
100%
|
|
|
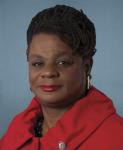
Rep. Gwen Moore | 4 |
Democrat
|
100%
|
100%
|
|

|
Rep. Mark Alford | 4 |
Republican
|
0%
|
0%
|
|

|
Rep. Thomas Massie | 4 |
Republican
|
0%
|
0%
|
|

|
Rep. Ken Buck | 4 |
Republican
|
%
|
11%
|
|
|
|
Rep. Jennifer McClellan | 4 |
Democrat
|
100%
|
100%
|
|
|
Rep. James Baird | 4 |
Republican
|
0%
|
10%
|
|
|
|
Rep. Aaron Bean | 4 |
Republican
|
0%
|
0%
|
|

|
Rep. Dan Newhouse | 4 |
Republican
|
0%
|
10%
|
|
|
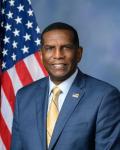
Rep. Burgess Owens | 4 |
Republican
|
0%
|
7%
|
|

|
Rep. Tom Cole | 4 |
Republican
|
0%
|
14%
|
|

|
Rep. Christopher H. Smith | 4 |
Republican
|
0%
|
29%
|
|

|
Rep. Scott DesJarlais | 4 |
Republican
|
0%
|
0%
|
|

|
Rep. Madeleine Dean | 4 |
Democrat
|
100%
|
100%
|
|
|
|
Rep. Anthony D'Esposito | 4 |
Republican
|
0%
|
0%
|
|
|
|
Rep. Mike Ezell | 4 |
Republican
|
0%
|
0%
|